Showing posts with label data sources. Show all posts

Saturday

Which population matters? Daytime or night time?

Another excellent post from Atlantic Cities.

Which population matters to planners, businesses and service providers? The number of inhabitants only captures part of the picture. New maps capture commuter data to show how cities grow or shrink during the day as people commute in or out for work. For example, Manhattan's population of about 1.5 million doubles to around 3 million every day.

As Emily Badger explains it:
If Manhattan ever needs to evacuate by day during a disaster, the city has to figure out what to do with all 3 million of those people. The city's transportation planners are responsible for every one of them, whether they live in New York or not. And anyone who does business in a service industry on the island – from lunch counters to dry cleaners to department stores – cares a lot more about how many people pass through during the day than who passes out in Manhattan at night. [...] This geography of how populations move on a daily basis should also tell us something about the importance of regional transportation infrastructure. If your city swells in size every day by 50,000 people or more, do you want all of them coming by car?


SME data

Another roundup: global SME data sources (with a focus on Asia).

General SME statistics
Google: "Google Directory- Sciences > Social Sciences > Economics > Indicators and Statistics > Official statistics > Asia." (Links to national statistical databases.)
Inforum: "Econdata."
ILO: “Key Indicators of the Labour Market (KILM) Programme.”
Inomics: "EconDirectory."
OECD: "SMEs and entrepreneurship."

Surveys
World Bank. "Doing business: benchmarking business regulations."
World Bank. "Enterprise surveys: what businesses say." (Contains some data sorted by firm size.)
World Bank. (2000). "World Business Environment Survey (WBES) 2000."
World Bank and European Bank for Reconstruction and Development. "The Business Environment and Enterprise Performance Survey (BEEPS)."

SMEs in Asia and in developing countries
APEC. "Small and medium enterprises working group."
ASEAN. "Economic integration: SMEs (links)."
DDCN. "Davidson Datacenter Network." (Focus on CIS)
UNIDO (2001). Development of clusters and networks of SMEs: The UNIDO programme. Vienna, United Nations Industrial Development Organization.
Ceglie, G. and M. Dini (1999). SME cluster and network development in developing countries: The experience of UNIDO. PSD Technical Working Paper, United Nations Industrial Development Organization.

Other useful links
AdmiNet. “Small and medium enterprises.”
UNCTAD. "StDev at UNCTAD (United Nations Conference on Trade and Development - Science & Technology for Development Network)."
World Bank. “Data and Research.”
World Bank. "World Development Indicators." (Contains some data sorted by firm size.)

Monday

Global R&D data

Here's a roundup of useful sources for data on global research and development (with a focus on corporate R&D). Some sources were featured in earlier posts.

General indicators

UNESCO statistics cover national data on number of researchers, technicians etc., proportion of women researchers, gross R&D expenditure, education level - among others.

World Development Indicators from the World Bank include some similar numbers as well as royalties and license fees, value added, ICT expenditures, highly skilled IT workers, scientific journal articles.

The World Bank's Knowledge Assessment Methodology compiles and compares various variables that are relevant to the knowledge economy. Composite, normalized indicators can be viewed as rankings, scorecards and maps. But you can also create your own graphs and tables. Most relevant R&D indicators are included.

The World Intellectual Property Organization provides WIPO Industrial Property Statistics collected from member countries on patents, trademarks, utility models, designs, plant varieties and microorganisms.

OECD science, technology and patent data. (Some datasets include major non-member countries, such as India, China and Brazil.)

For the US: NSF statistics on the science and engineering workforce available at SESTAT

On the globalization of corporate R&D and the impact of multinationals, especially in developing countries

UNCTAD has 3 particularly useful publications (all from 2005).

- WIR 2005. World Investment Report 2005: TNCs and the internationalization of R&D
- UNCTAD survey on the internationalization of R&D: Current patterns and prospects on the internationalization of R&D
- Globalization of R&D and developing countries. Expert Meeting, Geneva, January 2005
Also from UNCTAD: The UNCTAD Innovation Capability Index, first published in WIR 2005.

The internationalization of corporate R&D: Leveraging the changing geography of innovation. ITPS 2006. This includes country-specific case studies, incl. China and India.

5 surveys of corporate global R&D:

- Harnessing innovation: R&D in a global growth economy (Economist Intelligence Unit, May 2004)
- Scattering the seeds of invention: The globalisation of research and development (Economist Intelligence Unit, September 2004)
- Innovation: Is global the way forward? (INSEAD and Booz Allen Hamilton, 2006. Survey conducted May 2005)
- Innovation 2006. Annual innovation survey by The Boston Consulting Group
- R&D 100, 2005. IEEE Spectrum's Annual Survey of the top 100 R&D spenders

Saturday

BCG on R&D in India and China

Boston Consulting Group, Innovation 2006

Over the past year and a half, BCG has published various surveys, reports and “opportunities for action” on research and development in India, China and other rapidly emerging economies. The most interesting data are in the Innovation Survey 2006.

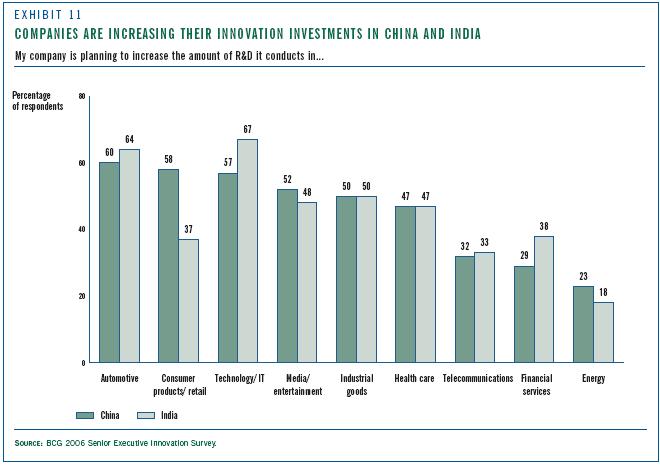
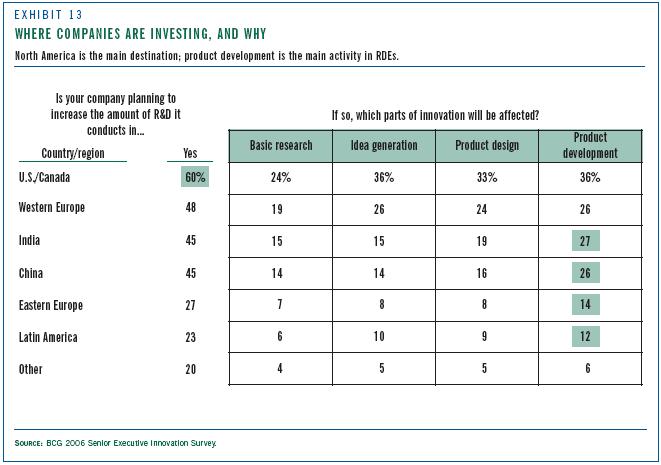
The largest target market for increased R&D spending remains the USA. And Western Europe still comes in second, albeit barely. India and China are rapidly becoming more important. About 45% of respondents said their company planned to increase R&D spending in China; and the same number planned to increase R&D spending in India. This is up from 2005, when only one-third of companies were planning to increase their R&D investments in 'rapidly developing economies.'

China draws increased R&D investments from significantly more consumer product/retail companies than India does. However in every other industry in the survey more or the same number of companies planned to increase their Indian R&D spending (see graph below). This comes as something as a surprise since it suggests stronger R&D growth for India than China. It is important to remember, though that China receives more foreign R&D investments in absolute terms - both FDI dollars and number of labs - and remains the most attractive location for future investments. (See UNCTAD's World Investment Report 2005 ch. 3-4.)


According to BCG's survey, cost – 34% of respondents – and localization (access to local markets) – 32% of respondents – are the main drivers for these investments. Access to R&D talent was mentioned by 21% of respondents.

The Economist Intelligence Unit (EIU) found similar drivers in their 2004 study but weighted them differently: Competition for talent, new technologies and easier market access have accelerated the process of R&D globalisation, with countries such as India and China hosting significant volumes of R&D activity for multinationals. Cost is a driver of globalisation too, but its significance can be overplayed as far as R&D goes. ... Speed of development is a more important benefit of the global research economy.

BCG also investigated the type of R&D being conducted in India and China. For anyone who's been watching the R&D space in Bangalore, Beijing and Shanghai it should come as no surprise that most of the investments are D rather than R. The main activity in India and China is product development, followed by product design. However, 15% of respondents said that their increased R&D spending would affect basic research and idea generation.

Conclusions
BCG encourages readers to reconsider the strategies in rapidly developing economies (RDEs), especially in terms of utilizing local talent to conduct more basic research and idea generation in these locations. This is somewhat at odds with the laments of companies that do engage in very high-end research: Development talent is plentiful, but research talent is very hard to find in most industries.

A note on the survey sample: Of the 1'070 respondents to the survey 450 were employed in the US, 71 in India, and 15 in China. The bulk of the rest were from Western economies. I wonder whether this skewed some of the comparative figures on India and China...

Sunday

Great new resource

The World Bank has a new initiative for Science, Technology and Innovation. The website describes their projects, lists relevant data and publications, and has an excellent collection of links to related organizations.

Tuesday

R&D in China and India: Great image, few reliable numbers

I’ve been working on a round-up of Indian and Chinese R&D statistics. The first thing that caught my attention was that (foreign) R&D in China seemed to be getting much more scholarly attention than Indian R&D.

A quick Google search provides some backup for this hunch. Searching Google Scholar for <India “R&D”> returns 21’600 hits. A search for <China “R&D”> returns 32’200 hits. Of course, there may be all kinds of junk in those hits, but a factor of 1.5 does show some difference. Another back of the envelope technique I used was to search for India and China in the journal “R&D management.” Searching for India returned 30 citations; searching for China returned 44. (Again, this needs to be taken cautiously since most of the differential is due to a special issue on R&D management in China).

On the other hand, in regular (business) news, the two countries are about even. The same Google searches as above in Google News returned 1’130 hits for India and 1’110 for China today.

Further searching showed that it’s quite difficult to put together a rough and ready overview of R&D statistics for India from the comfort of your desk. Few numbers are available online, and various databases contradict each other. (For example, the reported number of engineering and technology doctorates awarded in 1989 varies from 238 to 586, depending on the source.) The most useful numbers (for an outside investor) are provided by the software industry association, NASSCOM – and even these are meager and purely industry focused.

China, on the other hand, publishes a handy bunch of figures on the website of the Ministry of Science and Technology. Of course, Chinese government statistics are notoriously unreliable; but at least they appear to publish a uniform set of numbers and provide easy access to them.

The point here is less one of scholarly research than of marketing. India and China are competing for foreign R&D dollars (and spillovers). To do this, they need to demonstrate the availability of research talent. Conversations I have had, suggest that neither country is building its R&D strength on available resources. In both countries (though more so in China), proximity to a huge customer base is an important reason for firms to conduct R&D there. Lower costs also help. Both benefit from the West’s realization that India and China have very large college-educated populations.

However, “college-educated” does not equal “research-trained.” Several MNC labs have found that only a handful of elite schools provide the same kind of research training as they expect from researchers elsewhere in the world. As I heard time and again, development talent is plentiful; the research talent pool is very small.

Given a less than ideal labor pool, how do Bangalore and Beijing achieve their status of Asia’s R&D hubs? How can they expect to outperform Japan in terms of research?

China’s strategy has apparently been to muscle its way into the field by requiring foreign firms to set up labs if they wish to get permits for their low-cost factories – and by investing heavily in state-of-the-art infrastructure.

Bangalore seems to be benefiting from a halo effect: As the go-to spot for software development it becomes a natural location for IT research as well. In both countries, the case has also been made that returnees play a crucial role. As more interesting jobs open up (e.g. team leader in an R&D lab), more highly qualified emigrants find it worth their while to return home. Of course, more opportunities and market demand will eventually also have an effect on research training – whether in universities or in industry.

In the end, excellence in a field may translate into R&D prowess. And an image as an R&D hub may help sustain the current boom long enough for an adequate talent pool to develop. Until we have reliable numbers, though, nobody will be able to tell for sure.

Friday

Useful

HBS Working Knowledge has posted the link to the WTO's International Trade Statistics 2003 (pdf, 232 pages).